Participants
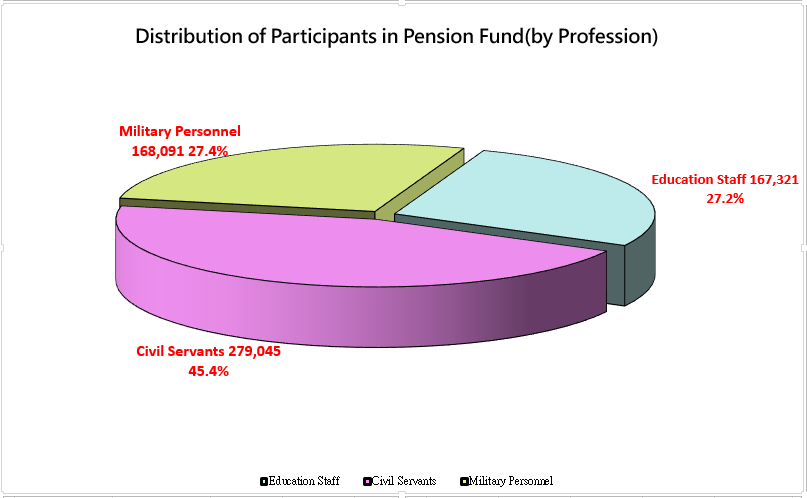
As of the end of December 2025, Pension Fund participation included 7,138 institutions and schools, and 614,457 individuals in the military, civil service and education categories. Among these, civil servants numbered 279,045 (45.41%), education staff 167,321 (27.23%) and military personnel 168,091(27.36%), respectively.
Contributions to the Pension Fund
In accordance with the pension regulations, the statutory contribution rates to the Pension Fund contributed by civil servants, military personnel and education staff range from 12% to 18% of double the basic pay. The current contribution rate is 15% dated from 1st January, 2023. Of the total contributions paid into the Pension Fund each month, the government bears 65% and individuals contribute the remaining 35%.
Historical Pension Fund Contributions, by Participant Category
Units: NT$100 million
Historical Pension Fund Contributions, by Participant Category
|
Category Fiscal Year
|
Military Personnel
|
Civil Servants
|
Education Staff
|
Political Appointees
|
Total
|
|
1996
|
-
|
113.91
|
38.37
|
-
|
152.27
|
|
1997
|
23.20
|
131.90
|
104.68
|
-
|
259.78
|
|
1998
|
49.16
|
137.48
|
113.53
|
-
|
300.17
|
|
1999
|
50.16
|
146.65
|
117.53
|
-
|
314.34
|
|
1999 2nd half & 2000
|
75.93
|
238.82
|
174.95
|
2.40
|
492.09
|
|
2001
|
53.47
|
159.19
|
128.20
|
0.42
|
341.29
|
|
2002
|
61.72
|
176.59
|
140.59
|
0.71
|
379.60
|
|
2003
|
62.60
|
180.18
|
142.97
|
0.72
|
386.48
|
|
2004
|
68.19
|
197.00
|
158.60
|
-0.03
|
423.76
|
|
2005
|
72.15
|
226.77
|
179.45
|
-0.05
|
478.31
|
|
2006
|
78.72
|
251.71
|
199.70
|
-0.06
|
530.07
|
|
2007
|
75.88
|
255.58
|
201.94
|
0.52
|
533.92
|
|
2008
|
79.94
|
257.55
|
206.64
|
0.59
|
544.72
|
|
2009
|
84.21
|
263.99
|
205.90
|
0.12
|
554.22
|
|
2010
|
89.04
|
271.19
|
207.34
|
0.48
|
568.05
|
|
2011
|
92.01
|
272.46
|
211.88
|
0.40
|
576.75
|
|
2012
|
98.05
|
276.28
|
215.67
|
0.46
|
590.46
|
|
2013
|
96.55
|
277.85
|
217.69
|
0.42
|
592.51
|
|
2014
|
97.17
|
279.22
|
219.76
|
0.44
|
596.59
|
|
2015
|
98.33
|
278.34
|
220.18
|
0.45
|
597.30
|
|
2016
|
98.88
|
277.39
|
219.35
|
0.45
|
596.07
|
|
2017
|
98.03
|
280.11
|
218.47
|
0.53
|
597.13
|
|
2018
|
137.31
|
292.72
|
227.91
|
0.48
|
658.41
|
|
2019
|
211.04
|
298.06
|
228.59
|
0.45
|
738.14
|
|
2020
|
213.04
|
364.04
|
308.36
|
1.04
|
886.47
|
|
2021
|
229.61
|
450.05
|
410.30
|
1.46
|
1,091.42
|
|
2022
|
253.01
|
504.35
|
453.97
|
0.76
|
1,212.09
|
|
2023
|
268.46
|
562.22
|
524.90
|
1.26
|
1,356.84
|
|
2024
|
281.04
|
632.70
|
587.59
|
1.25
|
1502.58
|
|
2025
|
290.86
|
723.50
|
624.03
|
1.28
|
1639.67
|
Note:
From January 2000 political appointees were retroactively brought into the pension system dating to 1 May 1996. From 1 January 2004 political appointee participation in the Pension Fund was discontinued; however, payments continued to be administered, with shortfalls in revenues and outlays to be compensated by governments at all levels according to law.